
[Bitop Review] Why BTC, ETH, and XRP Are on the Brink of Collapse: Shocking Bearish Signals Exposed
2025年10月21日发布
BTC
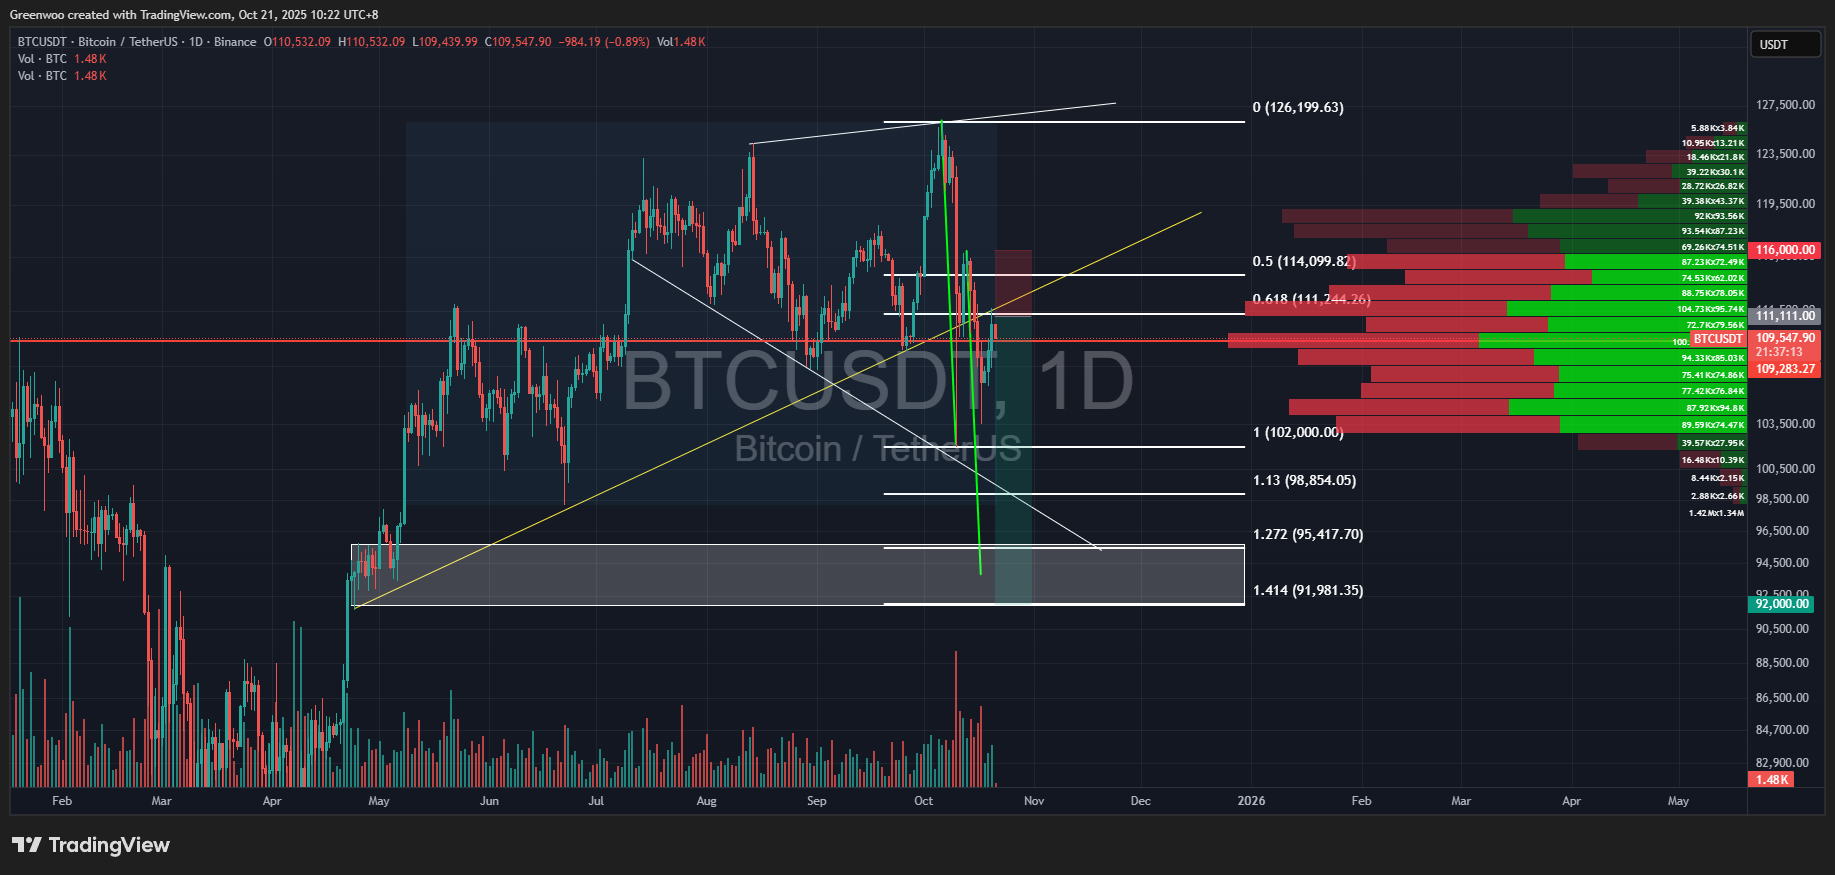
BTC rose to $111,705 yesterday (10/20), but trading volume did not increase alongside the price; instead, there was a trend of decreasing volume during the rise. This level also coincides with the lower edge of the ascending trend line and around the Fibonacci 0.618 level, presenting a certain degree of resistance. From a medium-term perspective, the price has formed an expanding top pattern (two white trend lines), with strong bearish implications.
In summary, it is expected that the price may encounter resistance again and decline in the future. At the time of writing, it is temporarily reported at around $109,542. Investors can choose to enter short positions at market price or set up short orders near the previous high of $111,705. Take-profit targets can be set in batches at $102,000, $98,850, $95,420, and $91,985. Stop-loss should be based on personal risk tolerance, with a maximum up to $116,000.
Reference Points:
Direction: Short
Entry: $109,542 (market price) - $111,111
Take-Profit: $102,000 / $98,850 / $95,420 / $91,985
Stop-Loss: $116,000
ETH
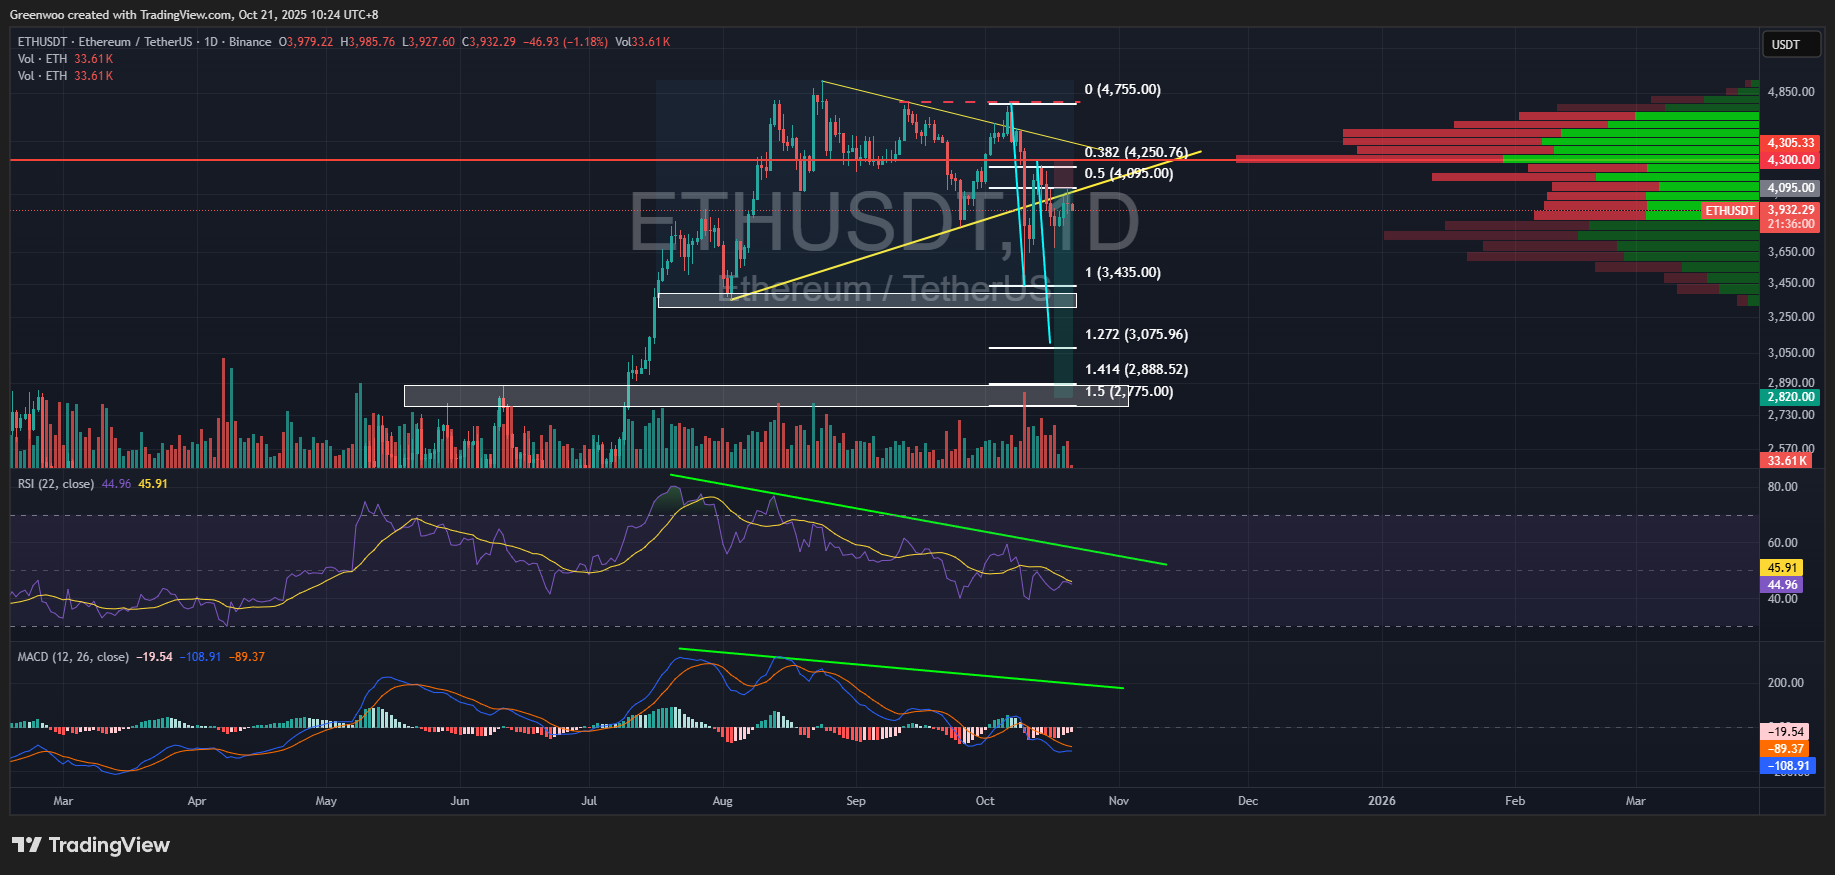
ETH's movement aligned with last week's prediction, rising to $4,085.38 before encountering resistance and falling, just under 10 points away from our predicted entry price of $4,095. The overall price pattern remains bearish-dominant, not only testing resistance on the pullback but also showing divergence in indicators. From the RSI and MACD indicators, divergence was already apparent before the sharp drop, with the price rising but the indicators falling—this is a typical bearish divergence. This situation is very suitable for shorting after the price breaks below the trend line.
In summary, investors can choose to enter short positions at market price. At the time of writing, it is temporarily reported at around $3,934, and entry prices between $3,900 and $4,095 are all good choices. Take-profit targets can be set in batches at $3,435, $3,080, $2,888, and $2,820. Stop-loss should be based on personal risk tolerance, slightly above the previous high of $4,292.
Reference Points:
Direction: Short
Entry: $3,934 (market price) - $4,095
Take-Profit: $3,435 / $3,080 / $2,888 / $2,820
Stop-Loss: $4,300
XRP
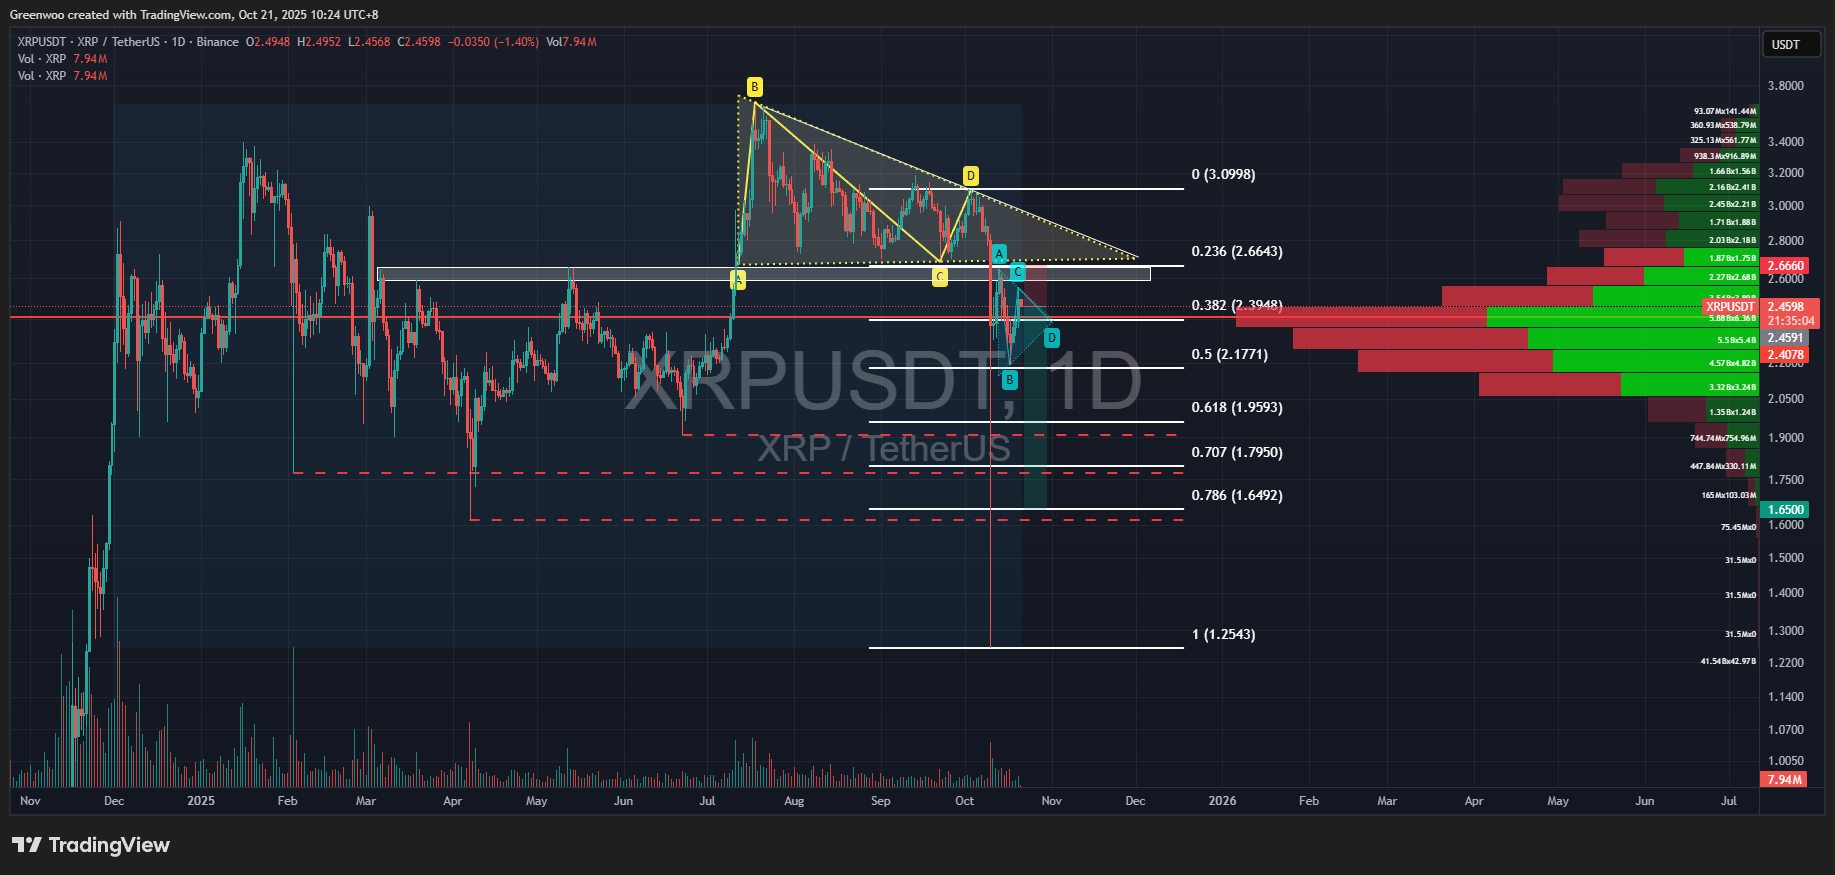
XRP showed signs of topping before the sharp drop on October 10, forming a descending triangle (yellow triangle) and continuously making new lows. After the sharp drop on October 10, although the price quickly rebounded, it has been unable to break above the lower pressure of the triangle. The price rebounded to $2.646 before encountering resistance and falling, with the resistance slightly below the Fibonacci 0.236 level. Subsequently, the price rebounded near the Fibonacci 0.5 level but encountered resistance again at $2.5529, forming a potential flag pattern (blue triangle), indicating that the downtrend may continue.
In summary, the overall market sentiment is heavily bearish, and investors can choose to gradually build short positions. At the time of writing, it is temporarily reported at $2.458. Investors can choose to enter at market price, with entry prices between $2.646 and $2.395 being good choices. Take-profit targets can be set in batches at $1.96, $1.8, and $1.65, based on the coincidence of previous lows and Fibonacci levels. Stop-loss should be based on personal risk tolerance, and can be set above the previous high of $2.65 or $2.666.
Reference Points:
Direction: Short
Entry: $2.458 (market price) / $2.395 - $2.646
Take-Profit: $1.96 / $1.8 / $1.65
Stop-Loss: $2.65 / $2.666
Disclaimer: None of the information contained here constitutes an offer (or solicitation of an offer) to buy or sell any currency, product or financial instrument, to make any investment, or to participate in any particular trading strategy.